Student Projects
VM495
Effect of Damage Position on Material Resonance Wave
Team Members: Gong Chun, Peng Xuezhi, Sun Tianxing, Yang Wentao, Yang Yunzheng
Project Video
Team Members
Team Members:
Gong Chun, Peng Xuezhi, Sun Tianxing, Yang Wentao, Yang Yunzheng
Project Description
Introduction
Nowadays researchers begin to pay more attention to the detection of structural damage, especially in construction and aviation industry. In this experiment, we try to analyze the resonance wave of aluminum bars with and without structural damages at different positions. The objective is to try to find the relationship between the resonance wave changes and the position of the damage.
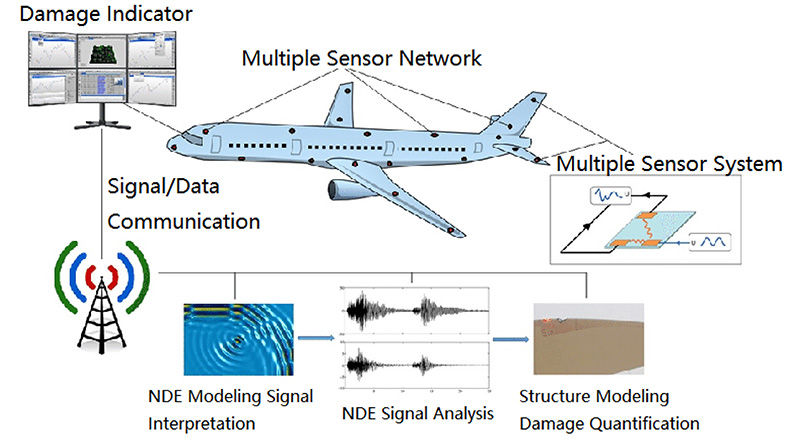
Fig 1. A Typical On-line Structural Health Monitoring System.1
Equipment and Setup
Piezoelectric Wafer Active Sensor (PWAS), is applied to convert electrical signals into vibration signals and vice versa, and the overall setup is as shown in Fig.2. Our target is to find the relationship between the damage position and the resonance wave.
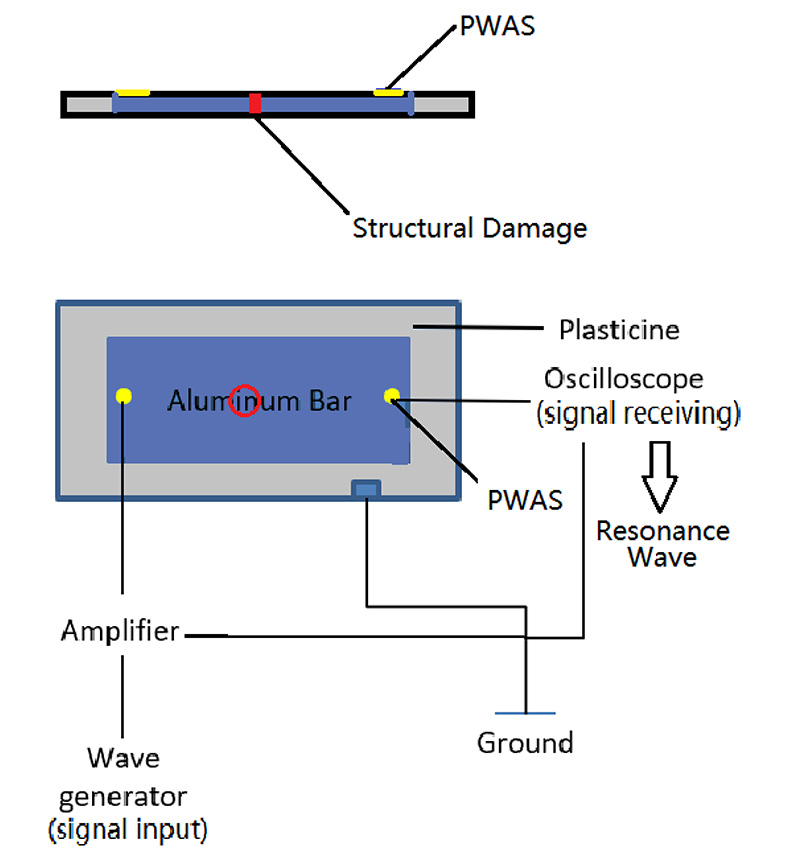
Fig 2. Equipment Setup
Theory & Methods
The experiment is divided into two parts. First, we swept frequency on the aluminum bar without damage. Since there are two wave packets for the diagram, we speculated that there would be two different frequency points which will maximize either amplitude. Each bar with two sensors would be tested under these two frequency points and the data will be analyzed in Matlab. We apply Lamb wave to detecting, with different wave package peak mode as shown in Fig.3 and Fig.4
As there exists noise due to the boundary reflection in the experiment which will result in some error, we use Fourier Transformation to minimize the influence and to conclude a general rules about the relationship between the damage position and the resonance wave.
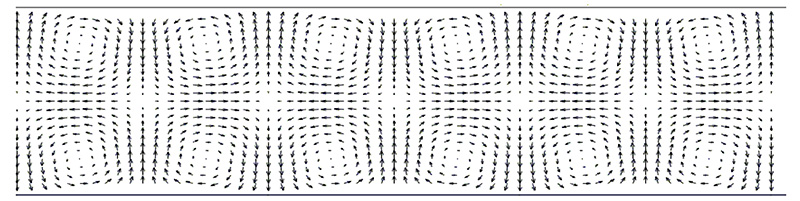
Fig 3. S0 Mode2
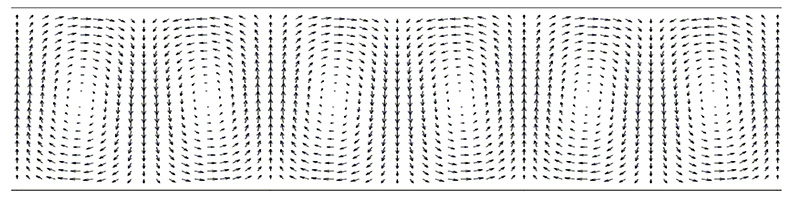
Fig 4. A0 Mode2
Results
The target variable is peak amplitude of voltage signal, which reflects the influence of damage and its position on material resonance wave. Since 143 kHz is the tested resonance frequency without damage, we applied it as input signal frequency. ANSYS simulation shows that the peak amplitude of voltage signal increases as the position of damage moves from the center to the end of bar (i.e. no damage). At the same time, for the two damages symmetric to the middle of the bar, the amplitude will be almost the same.
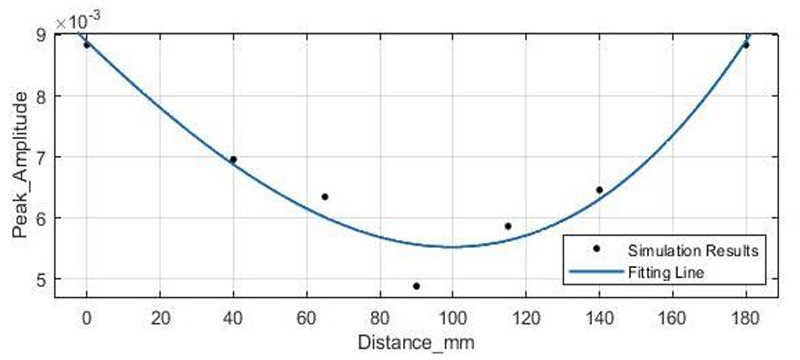
Fig 5. Simulation Results
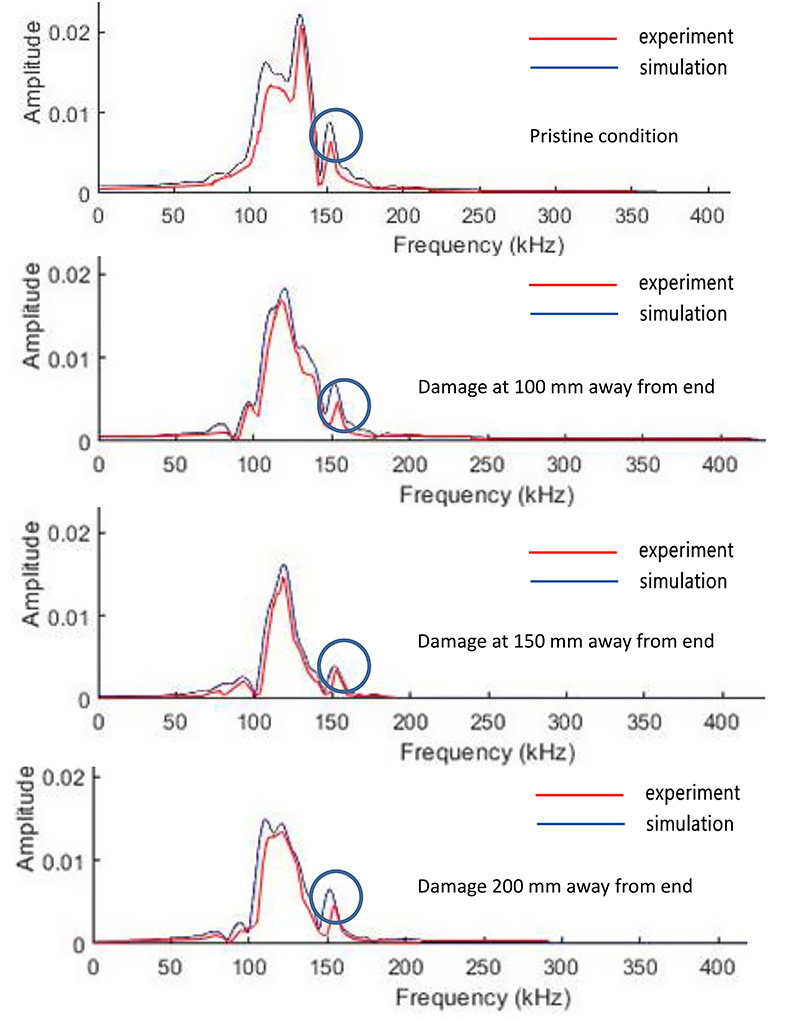
Fig 6. Experimental Results (red) vs Simulation Results (blue)
Reference
1. https://www.researchgate.net/figure/A-typical-on-line-structuralhealth-monitoring-SHM-system_fig1_303341678
2. Zagrai, A.; Giurgiutiu, V. (2001) “Electro-Mechanical Impedance Method for Crack Detection in Thin bars”, Journal of Intelligent Material Systems and Structures, Vol. 12, No. 10, October 2001, pp. 709-718 )